All stories · Case study
How a DTC brand cut COD RTO from 18% to 6% in four months
An agency moved a DTC brand's ad messaging from digestion to stress and anxiety, and says COD return-to-origin (RTO) fell from 18% to 6% while breakeven ROAS dropped from 2.5 to 1.8.
Share: WhatsApp · Telegram · X · Facebook · LinkedIn · Email

According to @KanishDigital, an agency operator, an unnamed DTC brand cut cash-on-delivery RTO from 18% to 6% in four months by changing the angle its ads lead with. The figures are self-reported in one X post, with no brand name or revenue data.
Kanish@KanishDigitalFrom 18% COD RTO to 6% in four months. One change did most of the heavy lifting.
Here’s what we learned:
Certain pain points attract high-RTO buyers by default.
Like weight loss, appearance, quick results.
Anything sitting at the bottom of Maslow’s hierarchy survival, looks, money.
These pain points have the widest audience. They’re easy to write. They get clicks fast. Orders faster
But the buyer they…Nov 10, 2026 · View on X
Before
- COD RTO: 18%, according to @KanishDigital. The post gives no exact start date.
- Breakeven ROAS: 2.5, per the same post.
- Ad messaging: digestion-focused. The post says the brand was shifted "from digestion messaging", so that was the starting angle.
- Other metrics: the post gives no starting prepaid share, order volume, revenue, CAC or ad spend.
@KanishDigital's diagnosis is that some pain points attract high-RTO buyers by default. The post lists weight loss, appearance and quick results, and says anything at the bottom of Maslow's hierarchy (survival, looks, money) behaves this way. These angles have the widest audience, are easy to write and get clicks and orders fast. But the post says the buyer they attract is impulsive, orders on emotion and rejects on delivery. With high COD and high RTO, "you scale the ad and the RTO scales with it."
What they changed
- Shifted the brand's messaging from digestion to stress and anxiety, according to @KanishDigital. The post calls this "one change" that did most of the heavy lifting.
- The post says this brought in a "completely different buyer", one with a higher prepaid percentage.
That is all the post says about the method. It does not describe ad creative, landing page changes, checkout or prepaid incentives, or any other tactic.
After
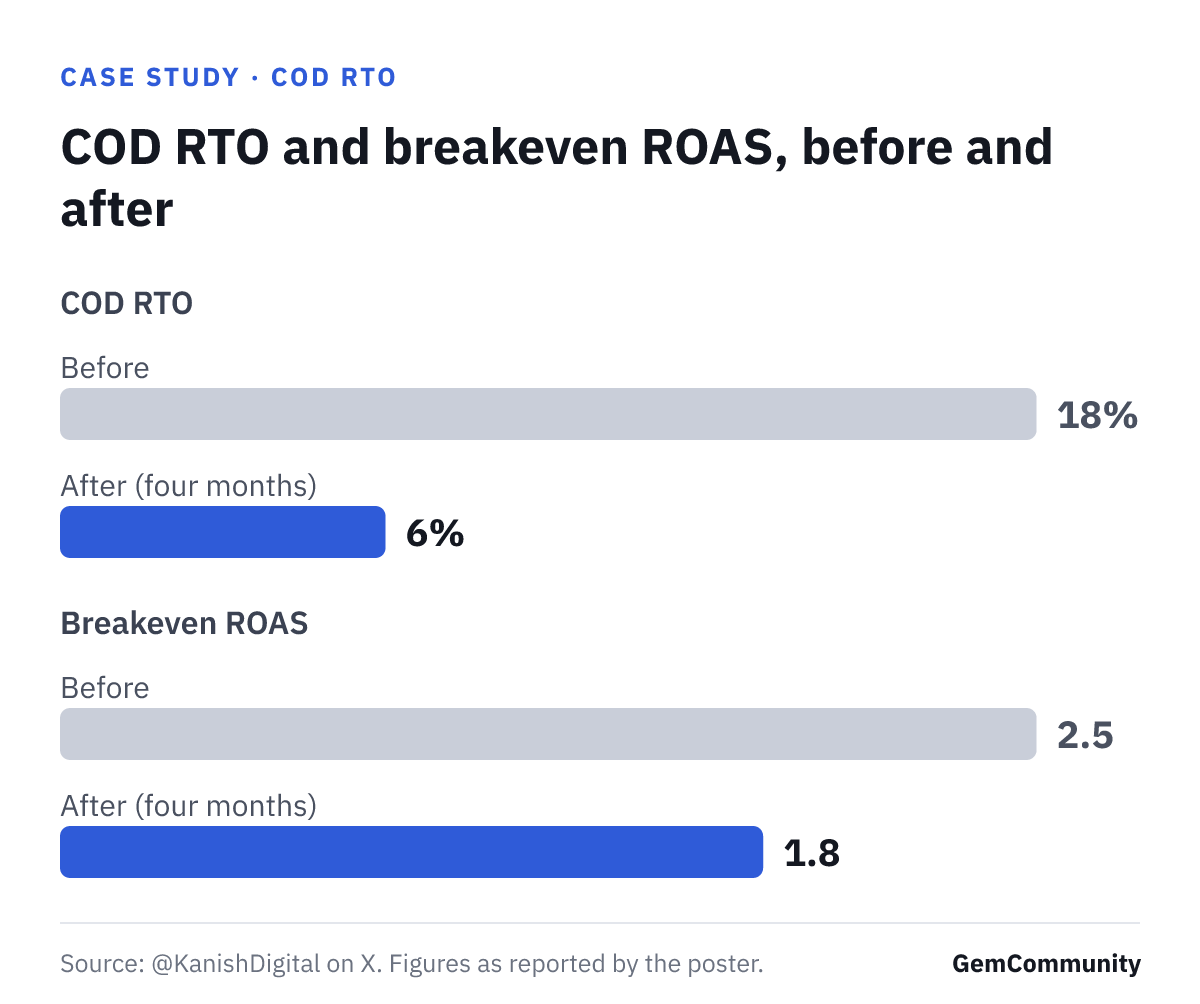
- COD RTO: 6%, down from 18% in four months (-67%, calculated from those two numbers), according to @KanishDigital.
- Breakeven ROAS: 1.8, down from 2.5 (-28%, calculated from those two numbers), per the same post. The poster ties this to the RTO drop.
- Prepaid share: described as "higher", with no number given.
- Scale: the post says the brand can now scale to ₹2 crore/month even faster. It gives no current spend or revenue.
All numbers are reported by the poster. The post does not say how RTO was measured, which channels or date range it covers, or whether other changes happened at the same time.
How can you test this on your store?
- Pull your RTO rate by ad angle or ad set for the last 60 to 90 days. Check whether your widest, easiest angles (looks, quick results, money) carry the highest returns.
- Pick one high-RTO angle and write a new angle aimed at a different pain point for the same product. Keep the offer and landing page as close as you can, so you can see what the angle alone changes.
- Run both angles side by side with similar budgets for several weeks.
- Compare prepaid percentage, COD RTO rate and net profit after returns for each angle, not just ROAS and orders.
- Recalculate your breakeven ROAS with the new RTO rate for each angle. If the new angle has lower RTO, your breakeven target should fall.
Treat this as a hypothesis test. One post from an agency does not show the result will repeat on your store.
Frequently asked questions
Which brand is this?
The post does not name the brand. @KanishDigital only describes it as a brand "we" shifted from digestion to stress and anxiety messaging, which suggests an agency client. Without a name, the result cannot be checked independently.
Who reported the numbers, and can you trust them?
@KanishDigital reported them in a single X post, and they are self-reported. The poster appears to run an agency that works on RTO and ecommerce, so there is a possible interest in showing results from client work. The post gives no revenue data, no measurement window beyond "four months" and no screenshots in the data we have, so treat the figures as a claim rather than verified results.
What exactly did the brand change?
According to @KanishDigital, the brand moved from digestion messaging to stress and anxiety messaging. The post says this attracted a different buyer with a higher prepaid percentage and lower RTO. No other changes are described.
Does this apply to stores outside India?
The post is about COD orders and quotes a target in rupees (₹2 crore/month), so it comes from a cash-on-delivery market. It says nothing about other regions. The general idea that the angle you lead with decides who buys is the part you can test anywhere, but the 18% to 6% result is specific to this brand.
Sources · 1 · x.com
Ask AI next
- How do I link returned COD orders in Shopify back to the ad set or ad angle that brought each buyer?
- How do I calculate breakeven ROAS for COD orders once return-to-origin shipping and handling costs are included?
- Besides changing the ad angle, which tactics like prepaid discounts or order confirmation calls reduce COD RTO?
- Which Shopify apps verify or flag risky cash-on-delivery orders before they ship?
- Which early signals show an ad angle is pulling in buyers likely to refuse COD delivery, before returns come back?