All stories · Article
Mobile drives 74% of BFCM traffic but just 62% of sales. The next CRO opportunity lies in increasing average order value (AOV).
Share: WhatsApp · Telegram · X · Facebook · LinkedIn · Email

Mobile accounted for 74.32% of traffic during BFCM 2025 but generated just 61.88% of sales. The gap starts with conversion, but it doesn't end there. Mobile orders were also worth less on average, revealing a second revenue opportunity that conventional mobile CRO checklists often overlook.
The revenue gap has two stages
Shopify sellers have spent years improving mobile shopping experiences. Responsive themes, sticky Add to Cart buttons, faster product pages and express checkout are now familiar parts of ecommerce optimization.
Yet Nosto's BFCM 2025 data suggests that making a store easier to use on mobile does not necessarily mean extracting the full revenue potential from its mobile traffic.
According to Nosto's BFCM 2025 analysis, covering more than 1,000 stores, the device breakdown was:
| Metric | Mobile | Desktop |
|---|---|---|
| Traffic share | 74.32% | 25.68% |
| Order share | 67.25% | 32.75% |
| Sales share | 61.88% | 38.12% |
| Conversion rate | 2.59% | 3.61% |
The numbers reveal two separate stages of revenue leakage.
First, mobile generates a smaller share of orders than its share of traffic.
Mobile attracts 74.32% of visits but accounts for 67.25% of orders. Its conversion rate is also lower than desktop's, at 2.59% versus 3.61%.
This does not mean mobile generates fewer orders in absolute terms. It means its contribution to orders is smaller than its contribution to traffic.
Second, mobile generates a smaller share of sales than its share of orders.
Its share falls again, from 67.25% of orders to 61.88% of sales. That points to lower average order value.
Based on Nosto's order and sales shares, the average mobile order is worth approximately 21% less than a desktop order. This is a calculated estimate, not a figure directly published by Nosto.
The distinction matters. Improving conversion can help close the first gap. But even if mobile converts more visitors into buyers, the second gap can remain.
A store can win more mobile orders without generating proportionally more mobile revenue.
Visual: Three-bar comparison of mobile traffic share (74.32%), order share (67.25%) and sales share (61.88%). Source: Nosto.
Most mobile CRO checklists stop at the first gap
Ahead of Black Friday 2026, Shopify CRO consultants have been encouraging merchants to test their stores on actual phones.
In his November 12 post, Goldi Kambale cited Nosto's BFCM figures and recommended a practical mobile audit.
The checks focus on the purchase journey:
- Is the Add to Cart button visible without scrolling?
- Are prices, discounts and product options easy to understand?
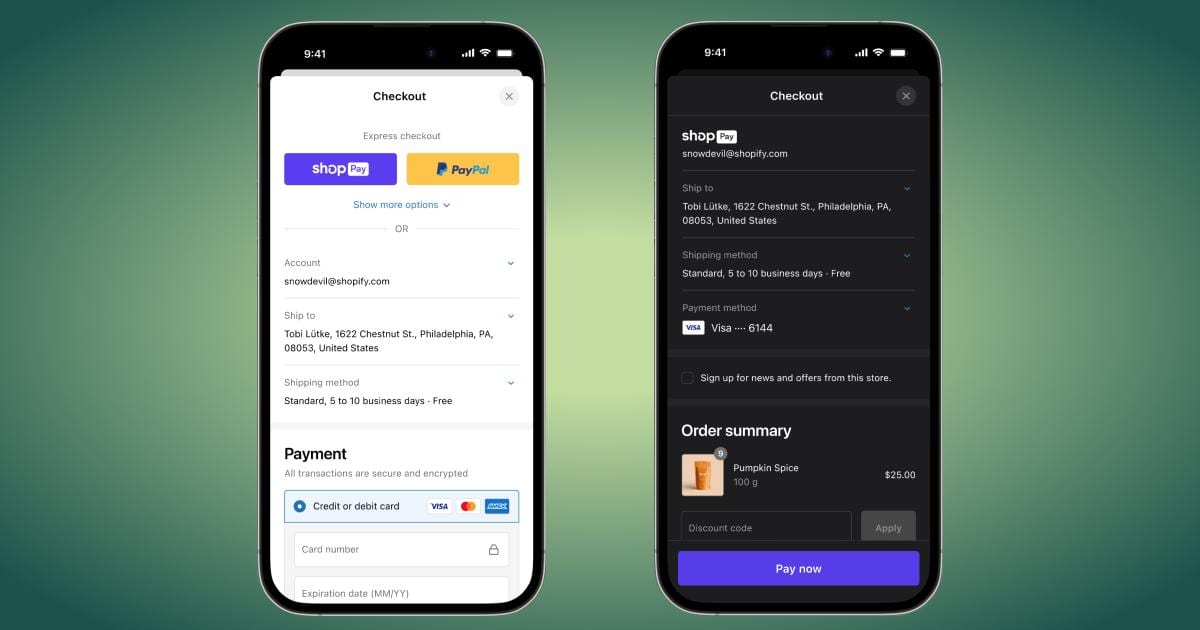
- Are express payment methods such as Shop Pay or Apple Pay available where relevant?
- Can shoppers move from the product page to checkout without unnecessary friction?
These are useful improvements. Baymard Institute's mobile ecommerce research documents how mobile-specific usability problems can make shopping more difficult.
But these checks mainly address the first gap: visitors who do not become buyers.
They say much less about the value of the orders customers actually place.
A shopper can find a product, add it to the cart and complete checkout smoothly, yet still buy only one item. They may skip a relevant complementary product or stop just below the free-shipping threshold.
The shopping experience can be optimized while the order itself remains relatively small.
Conversion isn't always the weakest link
There is another reason not to treat mobile conversion as the entire problem: industry benchmarks do not consistently show mobile converting worse than desktop.
Littledata's Shopify conversion benchmark reports median conversion rates of 1.5% for mobile and 1.2% for desktop over a 90-day period from August 10 to November 7, 2026.
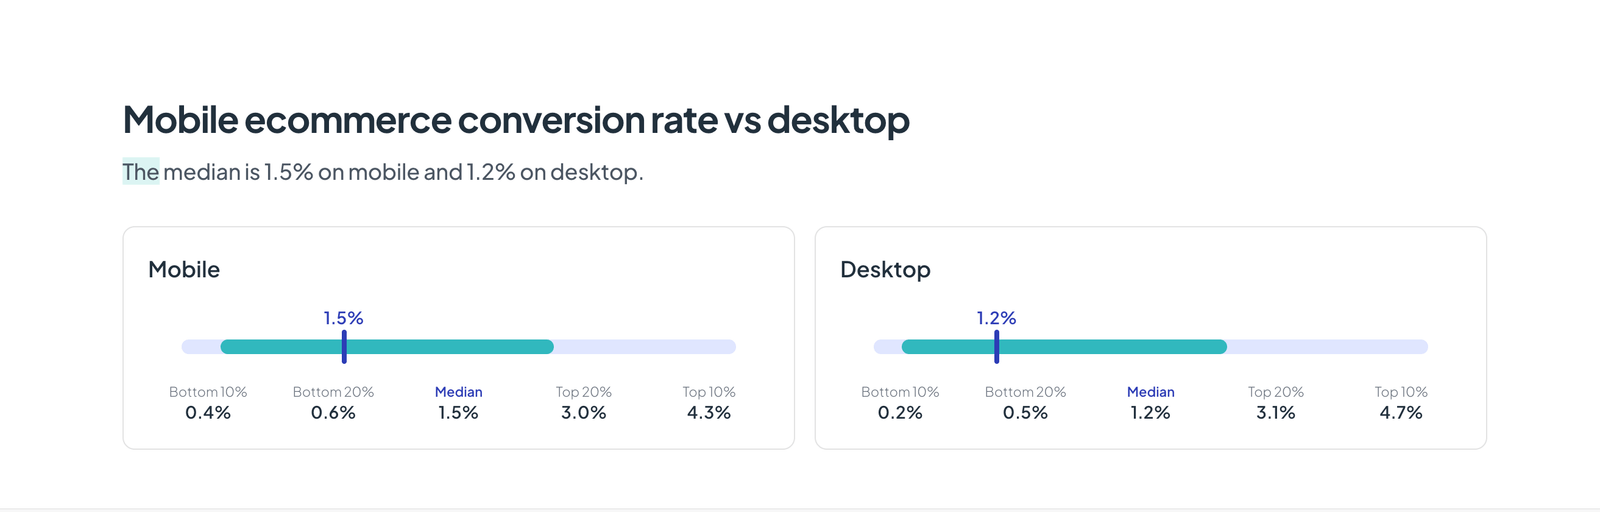
That is the opposite of Nosto's BFCM 2025 comparison.
The results are not necessarily contradictory. Nosto measures a peak shopping weekend across stores using its platform, while Littledata compares the median performance of Shopify stores over a longer period. The samples and measurement contexts differ.
Neither benchmark should be treated as a universal rule for every store.
Nosto's year-on-year figures offer another useful perspective. In 2025, mobile conversion increased 22.54%, faster than desktop's 14.66%. Yet mobile AOV declined 4.43%, while desktop AOV increased 9.52%.
Mobile conversion was improving faster, but the value of its average order was moving in the opposite direction.
That is the distinction a conversion-only analysis can miss.
The next mobile CRO opportunity may not be getting more visitors to buy. It may be getting more value from the orders they already place.
Find out which gap matters more in your store
Before changing the theme or installing another CRO app, examine your own device-level performance from BFCM 2025.
Start with three comparisons:
| Comparison | What it reveals |
|---|---|
| Traffic share vs. order share | Whether mobile converts its traffic efficiently |
| Order share vs. sales share | Whether mobile orders generate less revenue |
| Conversion rate and AOV by device | Whether the bigger opportunity is more purchases or higher-value orders |
If the traffic-to-order gap is larger, investigate conversion efficiency:
- Product-page engagement and Add to Cart activity.
- Checkout completion and payment options.
- Shipping costs and unexpected checkout charges.
- Mobile page speed and usability.
If the order-to-sales gap is larger, investigate order value:
- Number of products per order.
- Complementary products and relevant recommendations.
- Bundles and quantity-based discounts.
- Free-shipping thresholds and cart incentives.
This is particularly relevant for beauty and skincare sellers. Littledata's mobile traffic benchmark reports a median 73% mobile session share for beauty and skincare stores, the highest among the industries in its dataset. Health and supplements follow at 67%.
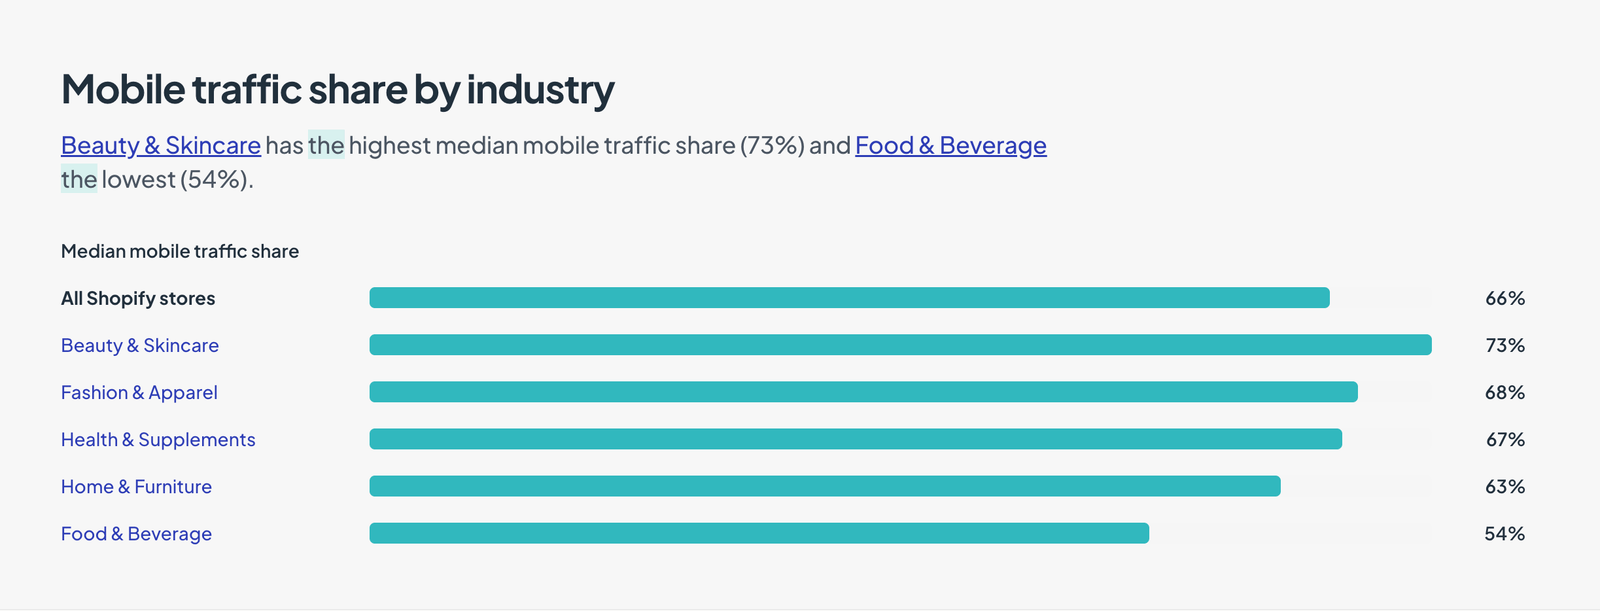
When mobile accounts for such a large share of visits, improving the value of each order can be just as important as improving the conversion rate.
Two gaps, two different fixes
With Black Friday falling on November 27, 2026, merchants have a limited window to test focused improvements before the peak shopping period.
If conversion is the bigger problem, reduce friction.
- Test the best-selling product page on a real phone.
- Make prices, discounts, product options and Add to Cart easy to find.
- Check the entire cart and checkout experience.
- Test available express payment methods.
If AOV is the bigger problem, give shoppers a relevant reason to add more.
- Test quantity discounts for products customers naturally replenish or buy together.
- Recommend complementary products that genuinely fit the main purchase.
- Test a free-shipping threshold slightly above the store's typical order value.
- Show the amount shoppers need to spend to qualify for free shipping directly in the mobile cart.
Shopify's AOV optimization guide also recommends testing bundles, relevant add-ons and order thresholds. But higher AOV does not automatically mean higher profit. Discounts, shipping and fulfillment costs must be included.
Do not launch every change at once. Test one intervention at a time and track conversion rate, AOV, revenue per session and profit per order.
Shopify merchants can use Behavior Reports to examine store traffic and shopping behavior. The important thing is to compare performance by device rather than relying on the store-wide average.
The goal is not simply to make mobile easier to use. It is to make mobile traffic more productive and mobile orders more valuable.
Before November 20, compare your store's BFCM 2025 traffic share, order share and sales share by device. Identify which gap is larger, then prioritize the fix that addresses it.
Ask AI next
- Which Shopify report shows orders, sales and AOV split by mobile and desktop, not only sessions?
- Does browsing on a phone and buying on a desktop make mobile conversion and AOV look lower than they really are?
- How do I add a free-shipping progress bar to the Shopify cart drawer on mobile?
- Can I set up bundles and quantity discounts in Shopify without a paid app?
- Which tools can A/B test a bundle or free-shipping threshold on Shopify and report AOV by device?